
Ok, let's explain the underpinnings of hypothesis testing
On our previous post, we left some concepts open, I hope to give them some footing now
Sebastian Arango V.
3/16/20252 min read


--content of this post is partially taken from https://github.com/quantopian/research_public/blob/master/notebooks/lectures/Hypothesis_Testing/notebook.ipynb, quantopian lectures are highly recommended. In this post i will layout some of my personal takes and hope to shed different and additional perspectives--
Hypothesis testing is part of statistical inference, which is the practice of making predictions about the whole population of data based on samples of such data, since, manipulating the whole population of data is often too expensive or simply impossible (future OHLCV candles...)
That is why we cannot simply take some probability from a sample and derive conclusions from it, it just describes the sample, and not the population as a whole, we cannot go and take the BTC returns on monday from the past 5 years, and if it is greater than zero, conclude that the whole population of BTC returns on monday will have an average greater than zero.
So, instead, during the hypothesis testing, a test statistic is computed from the sample statistic, the expected statistic under the null hypothesis (which is the expected situation), and the error associated to the sample statistic:

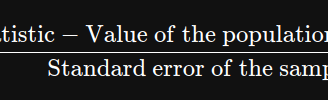
As the test statistic is closer to 0, we are more likely to not reject the null hypothesis, in other words, there is not sufficient data/proof for us to reject it. It gets closer to 0 if sample statistic is closer to the value of the population under Ho, or if error is too big (data sample is small or variance is big). The denominator is the part that encapsulates the noise that makes sample statistics, not our final answer.
Now, we need another important component, and that is, we must choose the probability of making a mistake in case we reject the null hypothesis (and Ho is true in reality), it is usually 5%.
And we those two values, we can compute our p-value, which we can easily compare to our significance level to determine whether or not reject the Ho.
If p-value < significance level, then we reject the Ho.
p-values are computed using the CDF (cumulative distribution function) of the test statistic, usually like:
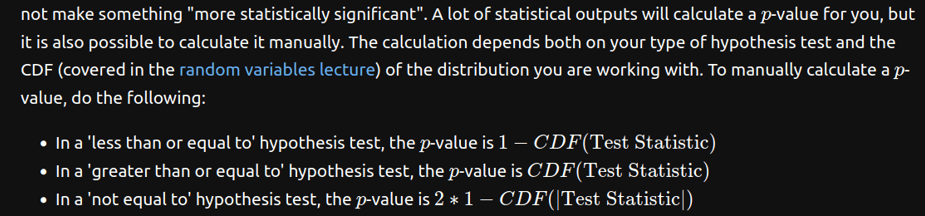
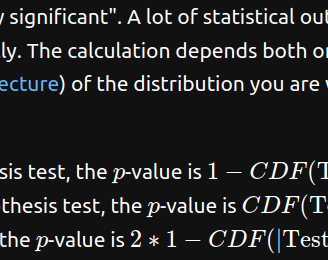
So, at a fundamental level, hypothesis testing is just, getting a test statistic accounting for the sampling error and then comparing it with its expected distribution if the null hypothesis were true, if it deviates from 0 (which is its expected value in case the null hypothesis were true) significantly, then we reject the null hypothesis.
The huge caveat behind hypothesis testing, is that it tends to have many assumptions over the population and how the data sampling was done, otherwise we might arrive to wrong conclusions. The quantopian lessons list out some of the common (and cute) statistical tests (Z-test, t-test...), but in the next post we will tackle directly the nuances we encounter when we do tests over time series.