
In the search of truth: Hypothesis Testing
How do we determine what is true and false in an uncertain world? even the true and false labels might not work at all. That is why we resort to Statistics and a method called Hypothesis testing to reach conclusions about the financial markets
Sebastian Arango V.
2/16/20255 min read
When we look at a chart, it is inevitable for our monkey brain to start making claims about it, it is similar to when we look at the clouds and start seeing faces or animal shapes. But that's it, they are simply claims, untested hunches, mere reflections of our deep desires or just educated guesses. At Quantty, we wish for those claims to become solid conclusions upon which we can build rich models that will help us explain the phenomena that occurs within the financial markets. That is why we will strictly follow the scientific method to refine our claims into hypothesis, that are then tested using statistical tools.
Hypothesis testing is crucial within the scientific method, especially in uncertain environments where decisions must be made based on incomplete or noisy data. It provides a structured way to evaluate claims, ensuring that conclusions are data-driven rather than based on intuition or anecdotal evidence. -GPT4o
GPT4o Touches on a very special property of time series encountered within financial data: they are fundamentally noisy, abundant random sequences of price quotes/returns, signal/alpha that is really low compared to that noise, which is, another way of saying that markets, are fairly efficient.
I may have gone through many concepts really fast, Random sequences, noise, signal/alpha, signal to noise ratio, the efficiency of markets. Do not be afraid, we will delve deeper into them later on.
And due to that prevalent noise/uncertainty, we must resort to hypothesis testing, since many of the claims that we make, might just be mirages, product of the noise. To counter the noise, we must take samples of data big enough over which we test our hypothesis.
So, I think the best way to continue, would be with a familiar situation:
Let's say, you noticed, in the last couple of weeks, that after BTC surges one day, it keeps going up the next day (or visceversa), it was just something you observed, so, i hope you will not try to code a bot that longs after a green day, and shorts after a red day, and back-testing the bot is also not needed, too much work, we can do a simple hypothesis test for this one.
Gonna use the Quantty platform, since it would be easier with it. We will head first to the Archive, and click on Create dataset, lets choose the Binance source, wait for the symbols to load, choose BTC/USDT, let the date range go from 2020-01-01 to 2025-01-01, choose period 1d and click on create.
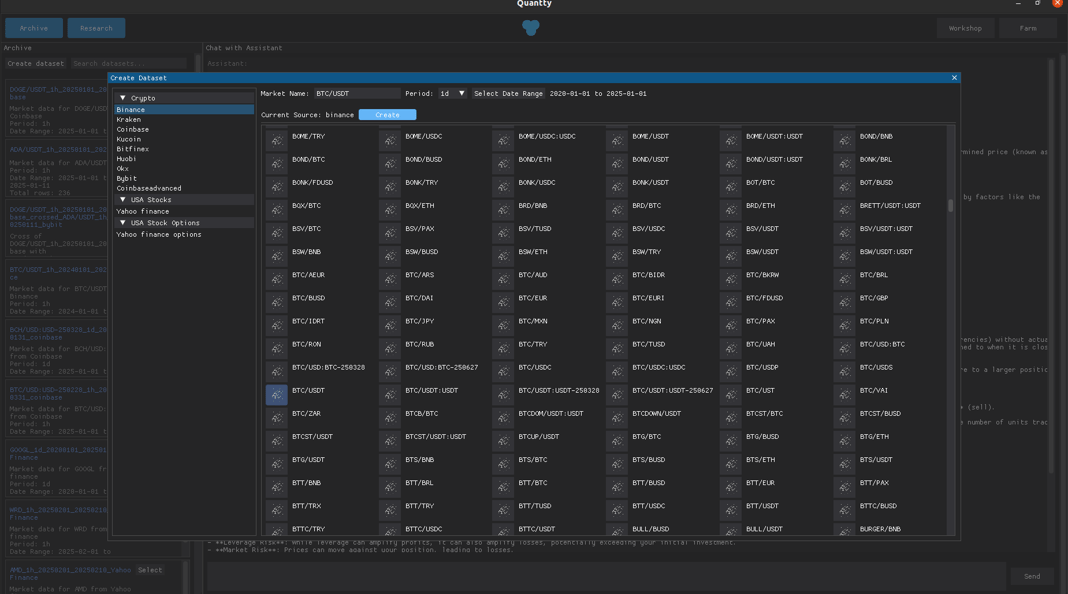
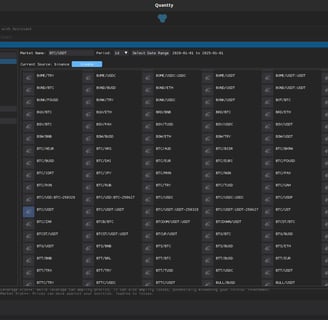
It should have downloaded over 1827 rows of data, and finally click Yes->Ok.
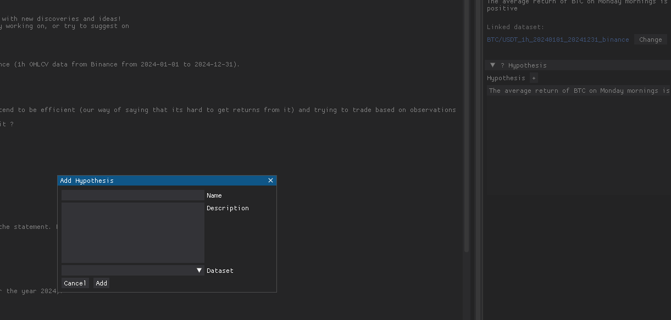
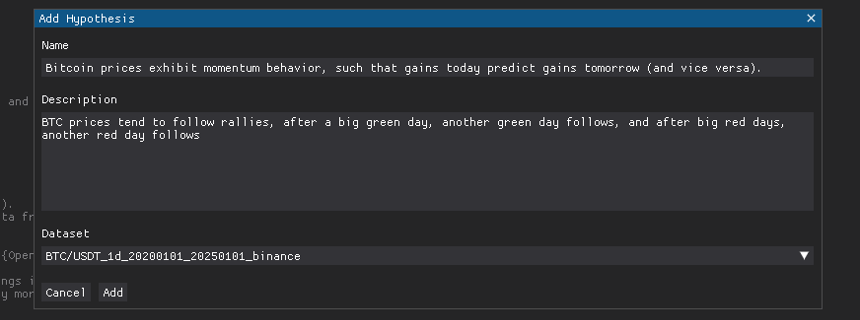
After that, head over the Research section, and create a new hypothesis, how should we name it?
...Due to the low signal-to-noise ratio present in the time series from financial markets, deep learning models should be used very carefully, since they might over-fit the noise more easily than in other settings where samples with little noise are part of the real distribution (image classification, text prediction...).
The previous observation could be denoted more formally as: "Bitcoin prices exhibit momentum behavior, such that gains today predict gains tomorrow (and vice versa)." Momentum is the tendency of things to keep going in a direction, since it takes effort to stop them or change their course.
And as a description, we can write something simple, such as the observation:
"BTC prices tend to follow rallies, after a big green day, another green day follows, and after big red days, another red day follows"
And we just choose the dataset we just fetched, then we click Add
I'll just click the formalize hypothesis suggestion, in a format suitable to perform the hypothesis testing
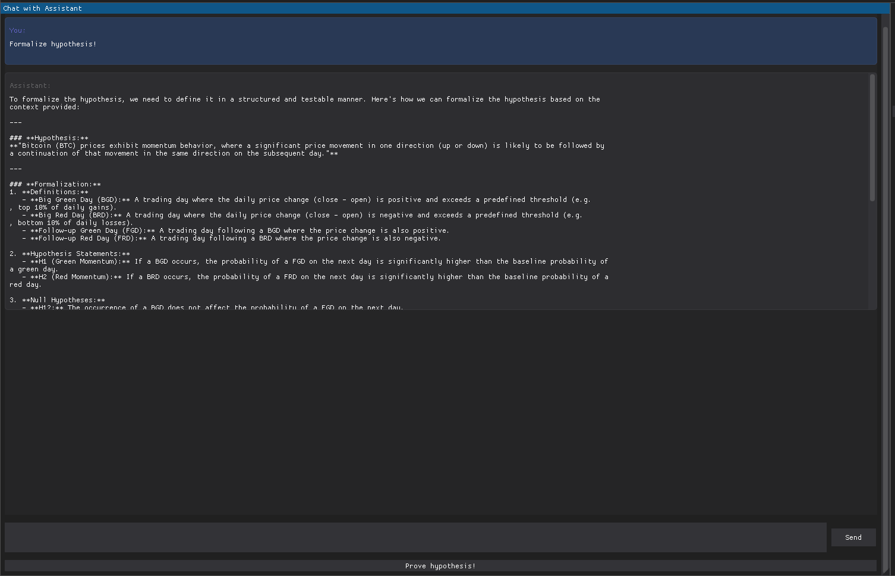
So, first thing it does are some definitions, like specifying numerically what we mean by Big days (daily absolute returns in their top 10% of total days for example (BGD, BRD)), and defining the follow up days (FGD, FRD)
Then it states two hypothesis:
H1: If a BGD occurs, the probability of a FGD on the next day is significantly higher than the baseline probability of a green day (the probability of a green day occurring on any day)
H2: If a BRD occurs, the probability of a FRD on the next day is significantly higher than the baseline probability of a red day (the probability of a red day occurring on any day)
So, get used to treating everything as a matter of probabilities, we will play with concepts such as conditional probability, probability over many events, probabilities over probabilities, etc.
Then, we must turn our hypothesis into null hypothesis, which are the ones we try to reject, they are like, the expected hypothesis in a noisy environment (like financial markets)
H1: The occurrence of a BGD does not affect the probability of a FGD on the next day
H2: The occurrence of a BRD does not affect the probability of a FRD on the next day
if we reject any of those hypothesis, we find a little edge in the market, a bias towards high vol days, strats are built on many more biases that we might find in the future, increasing the probability of having profitable days.
Later on, it defines the random variables we will use and compare to help us reject our hypothesis
we can give it more guidelines if you want, but i will just click in prove hypothesis (it will generate the code required to process the linked dataset, and also interpret the result, so it takes a couple of minutes to do it)
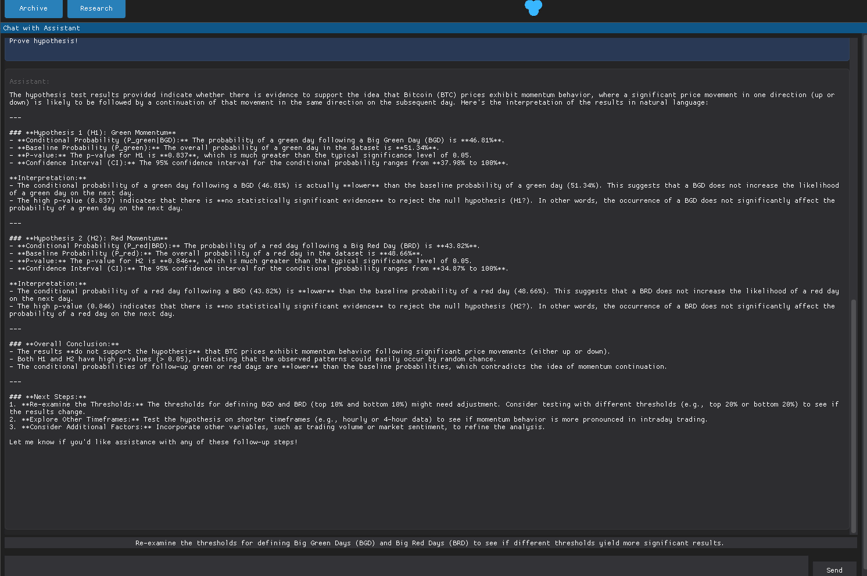
Quantty will give us a summary of the results, the conditional probabilities, baseline probabilities, the p-values (p-values will be explained in the next post) and the confidence intervals (They are just intervals in which our statistic is likely to be, with a certain significance level/chance)
So, since the p-values are way greater than 0.05, we cannot reject the null hypothesis unfortunately.
But! look at the conditional probabilities, they suggest that maybe the opposite is true, that after a BGD/BRD a FRD/FGD follows instead, which points to a curious property of BTC prices: They tend to be mean-reverting.
But a maybe is not enough, we should always tackle these questions with a hypothesis test, we will do so after explaining a little bit more the mathematical tools we use in the background.
Next post -> https://quantty.io/ok-lets-explain-the-underpinnings-of-hypothesis-testing